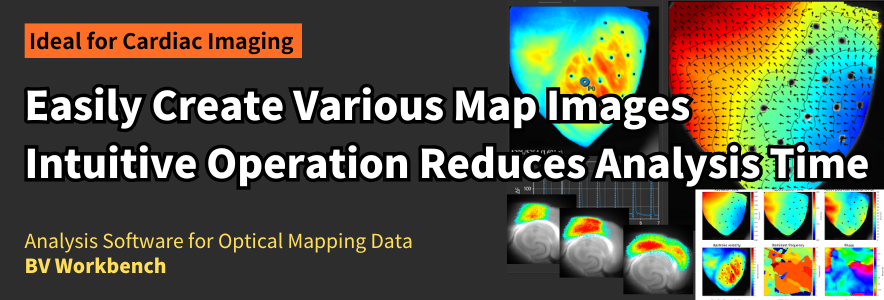
Analysis Software for Optical Mapping and Calcium Imaging
BV Workbench Ver.4 is the latest version of data analysis software developed for optical mapping and calcium imaging of the brain and heart.
In addition to data files acquired with Brainvision's MiCAM imaging system, it is also possible to open 16-bit TIFF files acquired with cameras and imaging systems from other companies.
In comparison to the previous version, this version has significantly improved functions such as cardiac analysis, various map displays, and image export. The software allows researchers to quickly create highly accurate output data for scientific papers.
Cardiac/Neuro Imaging Applications
- Langendorff perfused isolated heart
- Heart slice
- Cultured cardiomyocytes
- In Vivo brain
- Brain slice
- Cultured neurons
- Voltage sensitive fluorescent dyes such as Di-4-ANEPPS and FluoVolt
- Calcium-sensitive fluorescent dyes such as Fluo-4 and Cal520
- Fluorescent proteins such as GECI, GEVI, FRET
- Intrinsic signals based on hemoglobin and flavoproteins
Main Features
- Creation of various map images
- Easily output high-resolution images for use in scientific papers and presentations
- Intuitive and easy operation reduces analysis time
- Peak detection and optimum value setting can be done automatically
- Can also load 16bit TIFF files exported from third-party systems
- Technical support via email
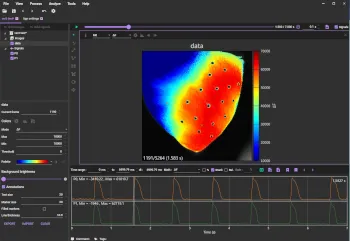
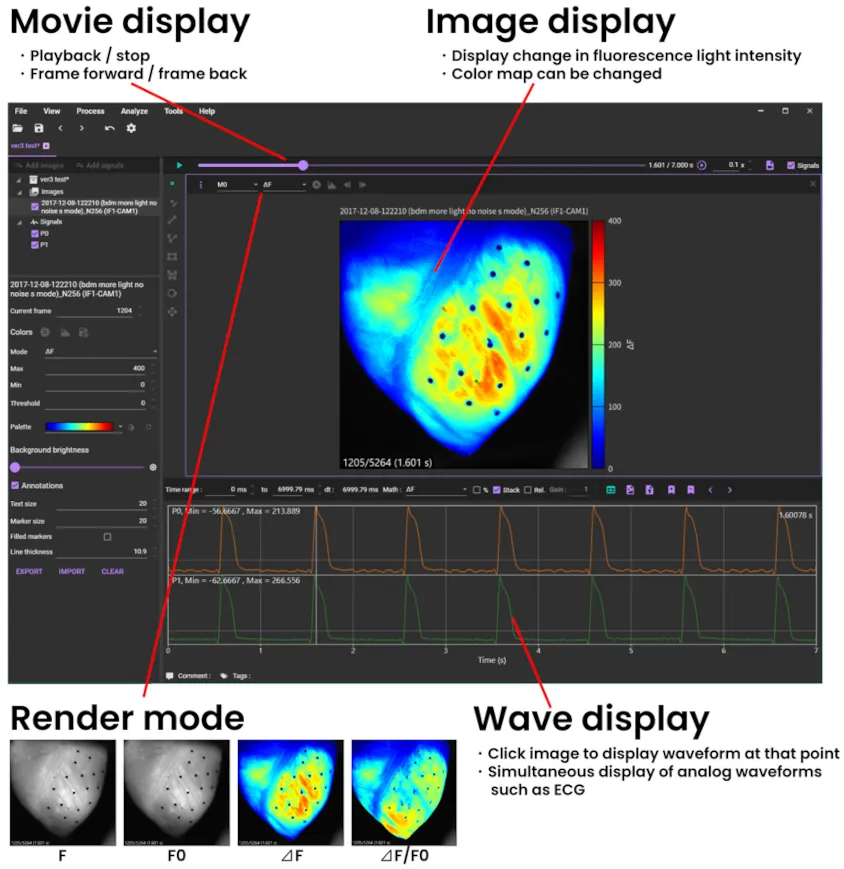
Features
Main window
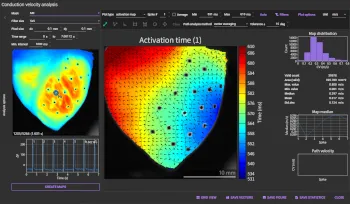
Analysis window
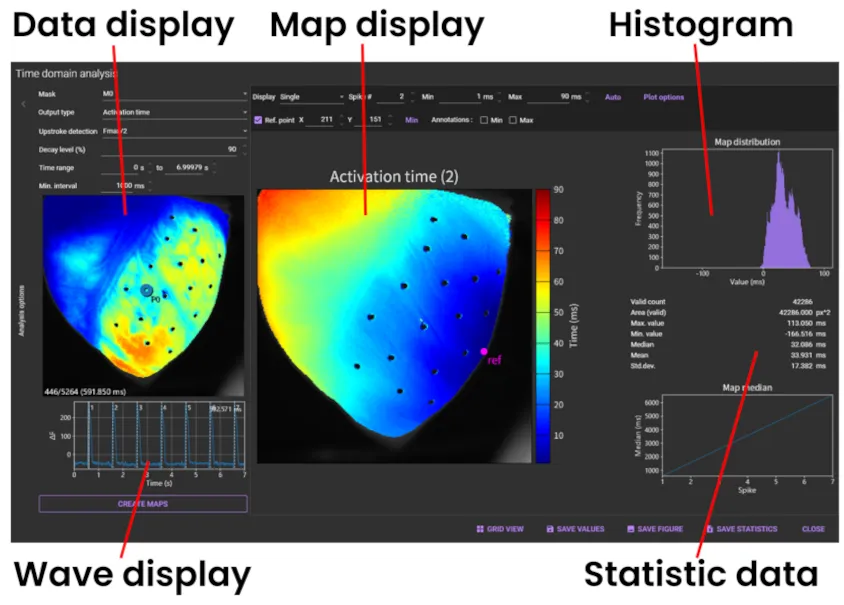
Image analysis/map creation functions for various experimental purposes
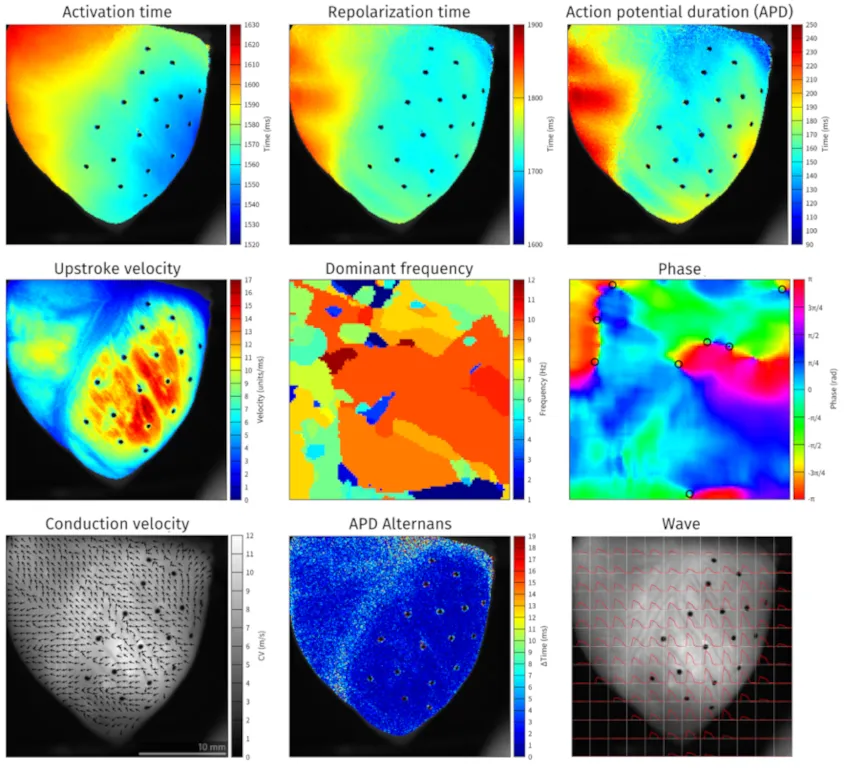
- Activation map / half rise map
- Repolarization map / half decay map
- APD map / CaTD map
- Phase map / Phase singularity / PS trajectory
- Conduction velocity map
- Dominant frequenct map
- Amplitude alternans map
- APD alternans map
- Maximum upstroke velocity map
- Diastolic interval map
- Decay τ (tau) map
- Rise time map
- Peak time map
- Peak amplitude map
- Peak to repolarization time map / Peak to half decay time map
- Peak interval map
Waveform analysis
-
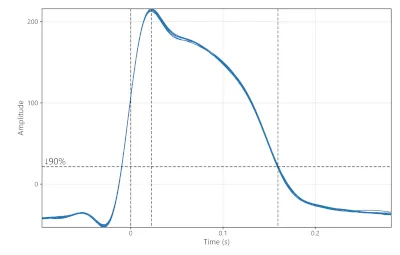 Waveform analysis
 -
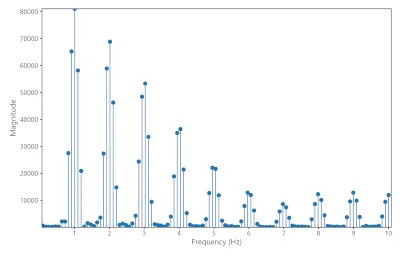 Frequency plot using Fast Fourier Transform
-
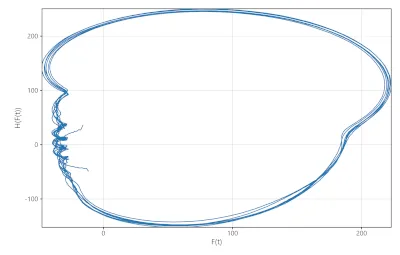 Phase plot using Hilbert Transform
 -
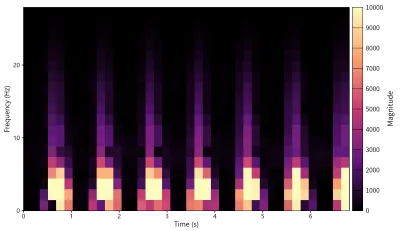 Short-Time Fourier Transform
From multiple peaks (action potentials and calcium transients), you can calculate average and standard deviation of APD (Action Potential Duration), Upstroke Velocity, Alternans, etc., and output them in CSV format.

- Peak amplitude
- Rise time
- Upstroke velocity
- xx% decay time
- Decay constant
- APDxx
- Diastolic interval
- Peak interval
- Alternans
- APDxx Alternans
Image export for quickly creating figures for papers, posters and slides
Images can be output in “PNG” format or “SVG” format.
“PNG” format is suitable for high-resolution printing without
degrading image quality.
“SVG” (Scalable Vector Graphics) can easily be modified using vector
graphics software like Adobe Illustrator, Inkscape...
Automatic peak detection, optimal value setting for filters/maps
Some functions are designed so that the optimum values are set even if the user does not specify them (values can also be changed manually by the user).
Various noise reduction filters and data correction to improve S/N ratio
| Name of filter/data correction | Descriptions |
|---|---|
| Illumination correction | Brightness correction / illumination non-uniformity correction |
| Distortion correction | Correction for lens distortion |
| Gaussian filter | Noise removal by Gaussian filter |
| Mean filter | Noise removal by mean filter |
| Median filter | Noise removal by median filter |
| Drift removal | Correction for photobleaching curve |
| Invert | Invert image and waveform polarity |
| Dynamic range optimization | Brightens dark images by optimizing light intensity value of each pixel to use the full 16-bit gradation |
| Normalization | Compensate for differences in amplitude of light intensity between pixels, and calculate so that light intensity values of all pixels have the same amplitude (0 to 65,535) |
| FIR filter | Noise removal by FIR (Finite Impulse Response) filter |
| Moving average | Noise removal by moving average filter |
| Savitzky-Golay | Noise removal by Savitzky-Golay filter |
| Alignment | Enlarge / reduce / rotate / move two images and overlay them |
| Binning | Combine multiple pixels into one pixel (addition or average) |
| Average datasets | Averaging data from multiple datasets offline |
| Crop | Specify an area and crop image |
| Deinterleave frames | Extract frames of data acquired by multi-wavelength excitation imaging such as GCaMP and Fura-2 and split them into multiple data |
| Manual drift removal | Correction for photobleaching curve. can be adjusted manually |
| Frame operation | Add / subtract / multiply / divide between two data in the same data set |
| Create subset | Specify time range and open as separate data |
Software updates several times a year
Continually adding new features and fixing bugs (random release dates)
Technical support by email
If you have any questions about using the software or analyzing data, please email us at any time.
Specifications
Supported data format
| Import | RAW | Format dedicated to this software |
|---|---|---|
| TIFF | Common 16bit grayscale tiff file | |
| GSD | Format for Brainvision's software BV_Ana | |
| Export | PNG | Image data, map data (high resolution) |
| SVG | Image data, map data (vector image) | |
| TIFF | Image data (actual resolution) | |
| CSV | Image data, Wave data | |
| Parquet | Wave data | |
| AVI | Video data |
Requirements
| Software | Operating system : Windows 10, 11 (64 bit) |
|---|---|
| Hardware |
Minimum - Any Intel or AMD x86-64 processor - 8 GB of RAM - 400 MB disk space for installation Recommended - Any Intel or AMD x86-64 processor with four logical cores and AVX2 instruction set - support. - 32 GB of RAM - NVMe Solid-state drive - NVIDIA GPU. See following section. |
Sample Video
Cardiac Optical Mapping Data Anaysis using BV Workbench Version 4.5.1
Download
Software license
In order to use BV Workbench, you need to activate it with a dedicated license (fee applies). Licenses are issued on a per computer basis using a hardware ID which is specific to each computer. You cannot authenticate one computer using a license issued for another computer. Please contact us for details on how to obtain and set the license.
Free trial
You can apply for a free 3-month trial.
Please contact us first!
Please click the "Contact Us" button
below to proceed to the inquiry form.
Download
Clicking on the link below will open a new page. The link directly under "BV Workbench" is the latest version.